
1. Introduction
In 2025, e-commerce is no longer about “who can launch ads the fastest.” It is about Unit Economics.
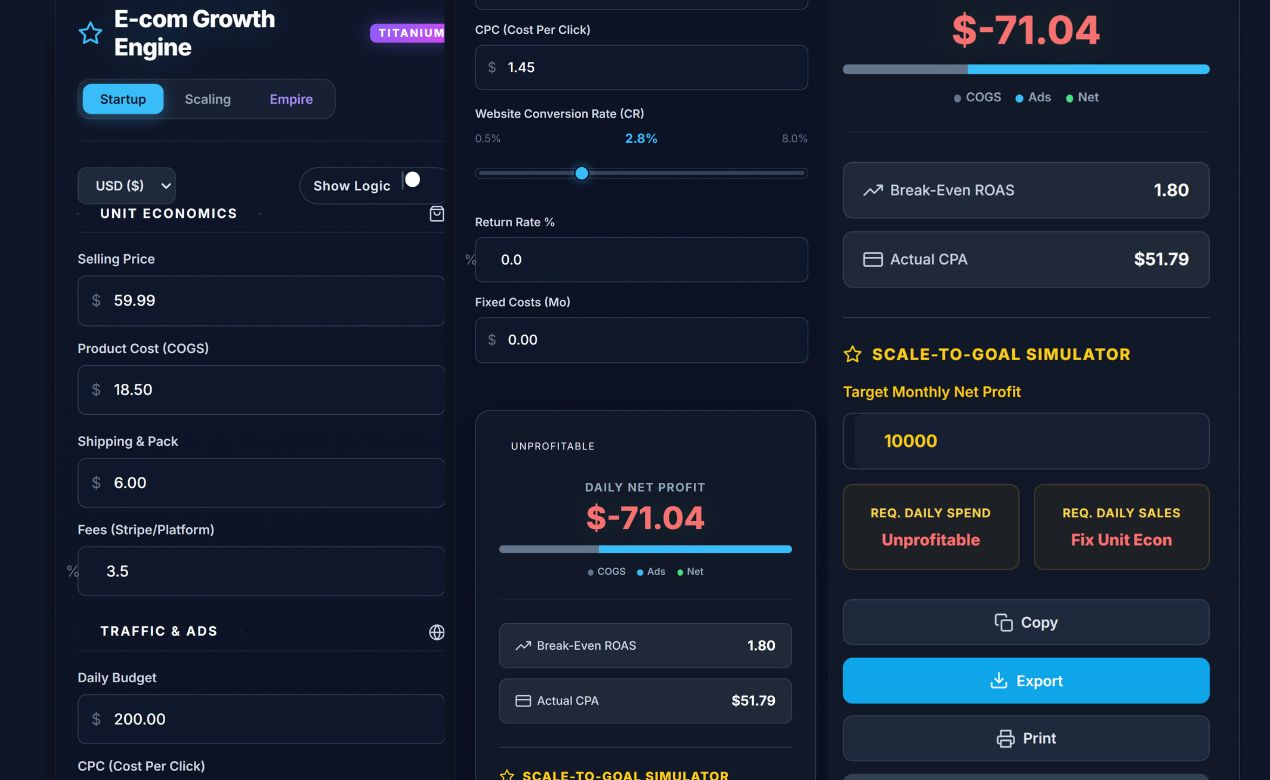
The Aisyntric Growth Engine is not just a spreadsheet; it is a strategic decision-making dashboard. It is the most advanced e-commerce profit calculator available in a browser, designed to help you master the hidden killers of profitability: payment processor fees, return rates, agency costs, and inventory cash flow delays.
Who is this tool for?
- Startup Founders: To validate if a product idea is financially viable before buying stock.
- Media Buyers: To calculate the exact “Break-Even ROAS” needed for Facebook or TikTok ads.
- Brand Owners: To forecast liquidity and model 12-month growth scenarios.
2. Getting Started
This e-commerce profit calculator is a “Single-File Application” designed for speed and privacy.
- To Open: Simply load the file in Chrome, Safari, or Edge. No internet connection is required for calculations.
- Auto-Save: The tool uses Local Storage to remember your data. If you close the tab and return tomorrow, your last inputs will be saved automatically.
- Reset: To clear all data and return to default benchmarks, click the Reset button at the bottom of the dashboard.
3. The Three Strategy Modes
Most e-commerce profit calculators are too simple. This engine adapts to your business stage using the toggle at the top right.
🟢 Startup Mode (Default)
Best for: Testing new products, dropshipping, or print-on-demand.
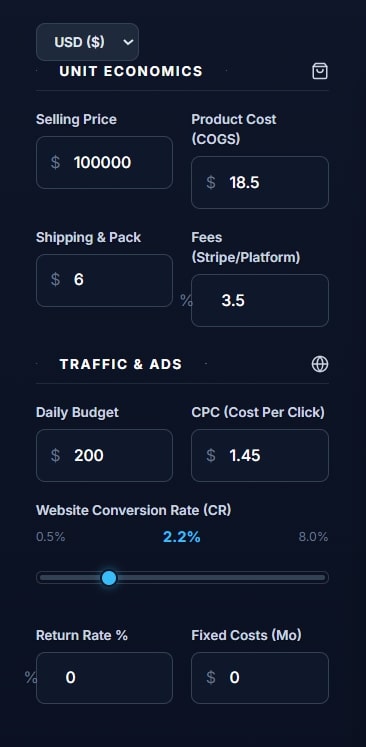
- Focus: Core Unit Economics.
- Key Inputs:
- Selling Price: What the customer pays.
- COGS: Your cost for the product + shipping.
- Fees: Usually 2.9% + 30¢ for Stripe/Shopify.
- Daily Budget: Your daily ad spend limit.
🔵 Scaling Mode
Best for: Brands doing $10k–$50k/month.
- Unlocks: Inventory tracking & Returns logic.
- Key Inputs:
- Return Rate %: A critical input for fashion/apparel brands.
- Fixed Costs: Monthly overhead like software subscriptions, salaries, or warehouse rent.
- Upsells: Post-purchase offers that increase AOV (Average Order Value) without increasing ad costs.
- Stock Units: Enter your current inventory count to enable the “Stock Days” warning system.
🟣 Empire Mode (Advanced)
Best for: 7-Figure Brands & CFOs.
- Unlocks: Cash Flow & Liquidity forecasting.
- Key Inputs:
- Supplier Terms: Do you pay your supplier upfront (0 days) or do you have Net-30 terms?
- Payout Delay: How long does Shopify/Stripe hold your cash? (typically 2-7 days).
- Reinvestment Rate: What percentage of profit do you pour back into ad spend next month?
4. Understanding Your Metrics
The “Big Three” Indicators
Unlike a basic e-commerce profit calculator, this dashboard visualizes your financial health instantly.
- Daily Net Profit: The actual cash left in your pocket today.
- Formula:
Revenue - (COGS + Shipping + Fees + Ads + Fixed Costs)
- Formula:
- Break-Even ROAS (Return on Ad Spend): The survival number for your media buying.
- Rule of Thumb: If your Break-Even ROAS is 1.6, you need to make $1.60 for every $1.00 spent on ads just to break even.
- Goal: Get this number as LOW as possible by increasing price or lowering COGS.
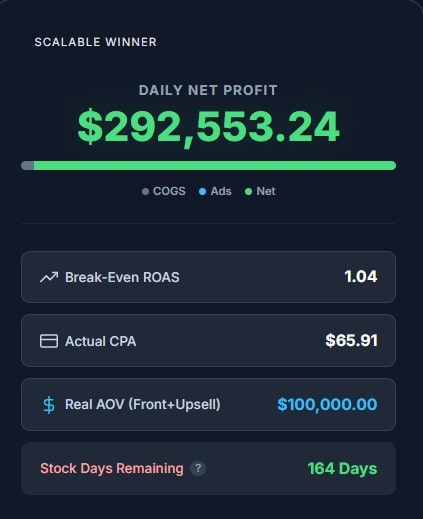
- Stock Days Remaining:
This metric calculates sales velocity based on your current ad spend. If this turns RED, it means you have less than 14 days of stock left and must order inventory immediately to avoid going dark.
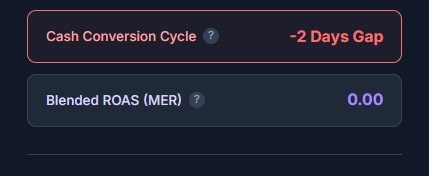
Cash Conversion Cycle (CCC)
Visible in Empire Mode only. This is the advanced feature that separates this tool from any other e-commerce profit calculator.
- Red (Positive Days): You are in a “Cash Gap.” You pay your supplier before the customer pays you. You need cash reserves to grow.
- Green (Negative Days): You are in a “Cash Float.” You get paid by customers before you have to pay your supplier. This is the holy grail of scaling.
5. Special Tools
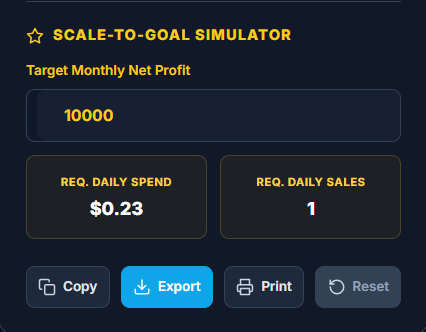
🚀 Scale-to-Goal Simulator
Stop guessing your budget. Use the simulator to reverse-engineer your success.
- Enter your Target Monthly Net Profit (e.g., $10,000).
- The calculator will tell you exactly:
- “You need $X in Daily Ad Spend.”
- “You need Y Daily Orders.”
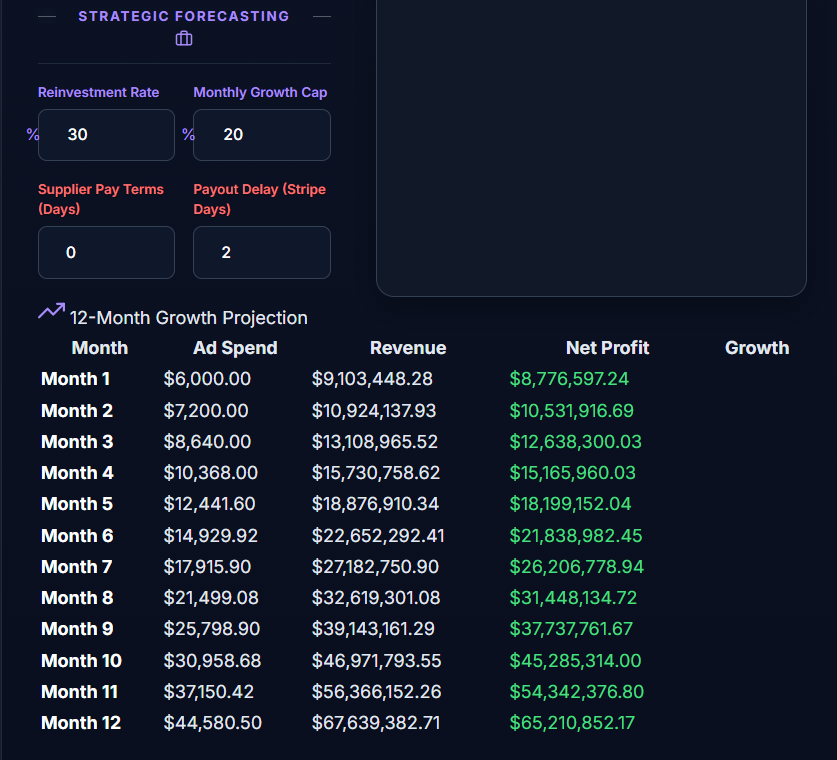
📅 12-Month Growth Forecast
Located at the bottom of the dashboard. This table predicts your future bank account. It assumes you reinvest a specific percentage of your profits back into ad spend every month to compound your growth.
- Tip: Use the “Growth Cap” input in Empire Mode to prevent unrealistic numbers (e.g., preventing the tool from assuming you can scale ads infinitely without breaking Facebook’s algorithm).
6. Expert Tips & FAQ
Q: Why is my Net Profit negative even though my ROAS is high? A: You likely have high “Fixed Costs” or “Return Rates” entered. A 3.0 ROAS might look profitable on a simple e-commerce profit calculator, but if you have $5,000/mo in overhead, you might still lose money at low volume.
Q: What is “Real AOV”? A: Most tools only look at the front-end price. “Real AOV” (Average Order Value) includes the money you make from Upsells and Cross-sells immediately after checkout. Increasing this by just 10% can double your Net Profit.
Q: How do I share this with my team? A: Click the “Export” button to download a CSV for Excel, or click “Print” to save a clean, ink-friendly PDF summary to send to your investors or partners.
7. Glossary
- COGS: Cost of Goods Sold.
- CPA: Cost Per Acquisition (Total Spend / Total Orders).
- MER: Marketing Efficiency Ratio (Total Revenue / Total Ad Spend). Better than ROAS because it tracks total business health.
- LTV: Lifetime Value (Total profit from a customer over 6-12 months).

Muhammad Talha breaks down complex AI tools into simple, step-by-step guides for e-commerce entrepreneurs. His goal: to help you work smarter, not harder, by leveraging artificial intelligence